Multiple Choice
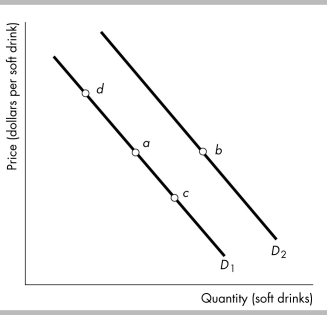
-Consider the demand curves for soft drinks shown in the figure above. Moving from point a to point c means that
A) the marginal benefit of each additional soft drink falls.
B) the opportunity cost of another soft drink increases.
C) people's incomes have decreased.
D) the price of a soft drink has increased.
Correct Answer:
Verified
Related Questions

