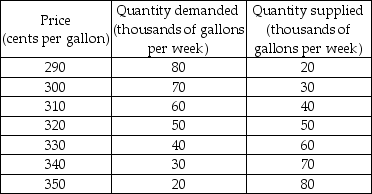
-A market research team has come up with the demand and supply schedules for gasoline in Motorville in the table above. Use these data to analyze the situation in the market for gas in Motorville.
a) Draw a figure showing the demand curve for gasoline and the supply curve of gasoline. What are the equilibrium price and quantity?
b) Suppose the price is $3.30. Describe the situation in the market and explain how the market adjusts. Now suppose the price is $3.00. Describe the situation in the market and explain how the market adjusts.
c) The market research report also predicts that a rise in the price of crude oil will decrease the quantity of gas supplied by 20,000 gallons a week at each price. Suppose the price of crude oil does rise. Use your figure to show how this will affect the market for gas. How will the market adjust? What will be the new equilibrium price and quantity?
Correct Answer:
Verified
View Answer
Unlock this answer now
Get Access to more Verified Answers free of charge
Q505: Young drivers often buy used cars. An
Q506: In the market for chocolate chip cookies,
Q507: If house purchases and renting an apartment
Q508: If the demand and supply curves are
Q509: During the mid-2000s, the average price of
Q510: The supply curve indicates the minimum quantity
Unlock this Answer For Free Now!
View this answer and more for free by performing one of the following actions

Scan the QR code to install the App and get 2 free unlocks

Unlock quizzes for free by uploading documents