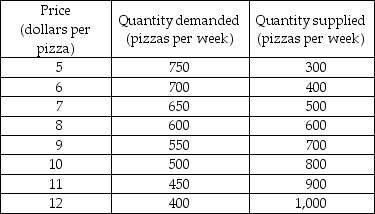
-A market research team has come up with the demand and supply schedules for pizza in Cheeseboro. These schedules are given in the table above. Use these data to analyze the situation in the market for pizza.
a) Draw a figure showing the demand curve for pizza and the supply curve of pizza. What are the equilibrium price and quantity?
b) Suppose the price is $10. Describe the situation in the market and explain how the price of pizza adjusts. Now suppose the price is $6. Describe the situation in the market and explain how the price of pizza adjusts.
c) The market research report also includes a prediction about the effect on the market for pizza in Cheeseboro of a recent news published in Cheeseboro Herald. The Herald reported that pizza has been discovered to help prevent heart diseases. Unfortunately, your dog chewed up the report and all you can read about the prediction is "quantity... by 150 at each price." What does the prediction say? Use your graph to show the predicted effects on the market for pizza. What are the predicted equilibrium price and quantity? How will the market adjust?
Correct Answer:
Verified
View Answer
Unlock this answer now
Get Access to more Verified Answers free of charge
Q505: Young drivers often buy used cars. An
Q506: In the market for chocolate chip cookies,
Q507: If house purchases and renting an apartment
Q508: If the demand and supply curves are
Q509: During the mid-2000s, the average price of
Q510: The supply curve indicates the minimum quantity
Unlock this Answer For Free Now!
View this answer and more for free by performing one of the following actions

Scan the QR code to install the App and get 2 free unlocks

Unlock quizzes for free by uploading documents