Multiple Choice
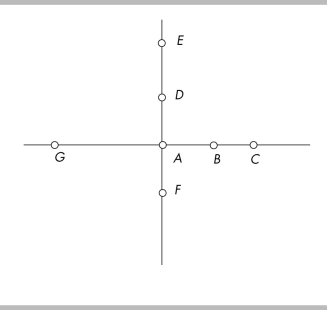
-In the figure above, the value on the x-axis increases as we move from
A) point G to point A.
B) point C to point A.
C) point F to point A.
D) point E to point A.
Correct Answer:
Verified
Related Questions
Q259: Q260: Scarcity affects only those who are in Q261: A scatter diagram shows the Q262: You notice that when the inflation rate Q263: Q265: Q266: Q267: A scatter diagram will be most useful Q268: On a graph, high correlation between the Q269: Unlock this Answer For Free Now! View this answer and more for free by performing one of the following actions Scan the QR code to install the App and get 2 free unlocks Unlock quizzes for free by uploading documents![]()
A) level of![]()
![]()
![]()
A)![]()

