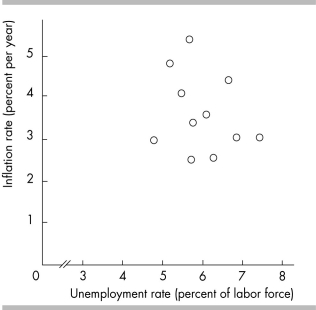
-In the above figure, the axis break in the x-axis
A) reflects the fact that for the years covered in the figure, the unemployment rate was never less than 3 percent.
B) shows that there is no relationship between inflation and unemployment.
C) misleadingly shows that inflation has changed very little even though the unemployment rate has increased a great deal.
D) implies that for the years covered in the figure, the inflation rate was always greater than 1 percent.
Correct Answer:
Verified
Q260: Scarcity affects only those who are in
Q261: A scatter diagram shows the
A) level of
Q262: You notice that when the inflation rate
Q263: Q264: Q266: Q267: A scatter diagram will be most useful Q268: On a graph, high correlation between the Q269: Q270: Unlock this Answer For Free Now! View this answer and more for free by performing one of the following actions Scan the QR code to install the App and get 2 free unlocks Unlock quizzes for free by uploading documents![]()
![]()
![]()
A)![]()
![]()

