Multiple Choice
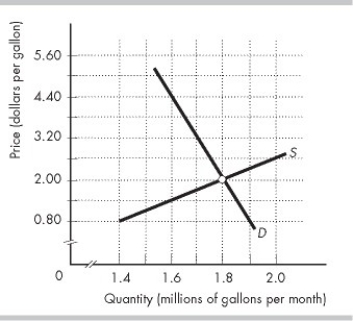
-In the figure above, S is the supply curve and D is the demand curve in the unregulated, competitive market for gasoline in Motorland. The external cost of gasoline is constant at $1.50 per gallon. The efficient quantity of gasoline to sell in Motorland is
A) 1.7 million gallons per month.
B) 1.8 million gallons per month.
C) 1.6 million gallons per month.
D) 1.9 million gallons per month.
Correct Answer:
Verified
Related Questions

