Multiple Choice
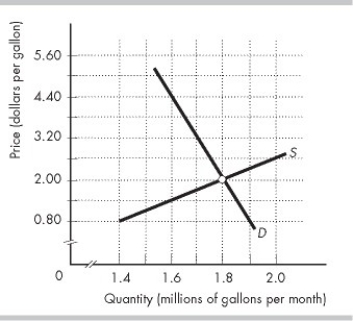
-In the figure above, S is the supply curve and D is the demand curve in the unregulated, competitive market for gasoline in Motorland. The external cost of gasoline is constant at $1.50 per gallon. Suppose Motorland's government imposes a tax of $1.50 per gallon of gasoline sold. With the tax, the market will
A) underproduce by 0.2 million gallons of gasoline a month.
B) underproduce by 0.1 million gallons of gasoline a month.
C) overproduce by 0.1 million gallons of gasoline a month.
D) produce the efficient quantity of gasoline.
Correct Answer:
Verified
Related Questions

