Multiple Choice
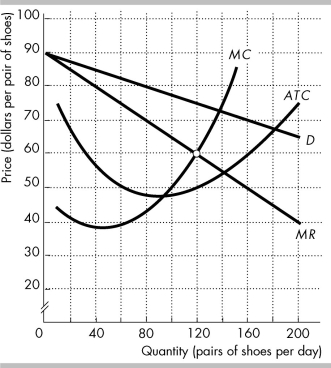 The figure shows the demand curve for Nike shoes (D) , and Nike's marginal revenue curve (MR) , marginal cost curve (MC) , and average total cost curve (ATC) .
-In the figure above, Nike's economic profit is
A) $3,000.
B) $1,800.
C) $9,000.
D) zero.
Correct Answer:
Verified
Related Questions

