Multiple Choice
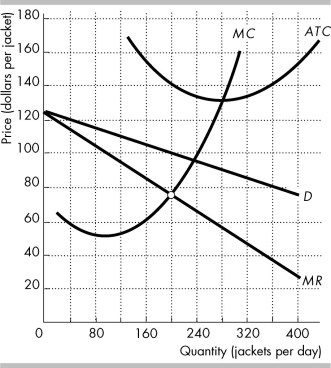 The figure shows the demand curve for Gap jackets (D) , and Gap's marginal revenue curve (MR) , marginal cost curve (MC) , and average total cost curve (ATC) .
-In the figure above, Gap maximizes its profit if it sells ________ jackets per day.
A) 200
B) 240
C) 275
D) 140
Correct Answer:
Verified
Related Questions

