Multiple Choice
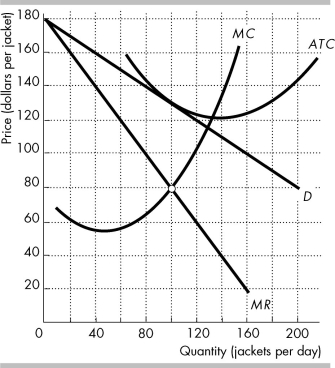 The figure shows the demand curve for Gap jackets (D) , and Gap's marginal revenue curve (MR) , marginal cost curve (MC) , and average total cost curve (ATC) .
-In the figure above, if the market for jackets were perfectly competitive, in long-run equilibrium, each firm would sell ________ jackets per day at ________ per jacket.
A) 132; $122
B) 100; $130
C) 100; $80
D) 128; $114
Correct Answer:
Verified
Related Questions

