Multiple Choice
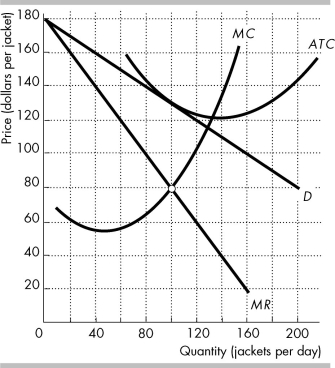 The figure shows the demand curve for Gap jackets (D) , and Gap's marginal revenue curve (MR) , marginal cost curve (MC) , and average total cost curve (ATC) .
-In the figure above, what is Gap's excess capacity?
A) 32 jackets per day
B) zero
C) 4 jackets per day
D) 132 jackets per day
Correct Answer:
Verified
Related Questions

