Multiple Choice
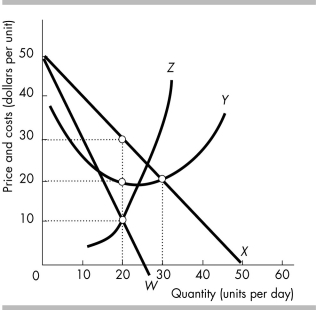
-The figure above shows the cost, demand, and marginal revenue curves for a monopoly. At an output level of ________, demand is ________.
A) 20; elastic
B) 50; unit elastic
C) 50; elastic
D) 30; unit elastic
Correct Answer:
Verified
Related Questions

