Multiple Choice
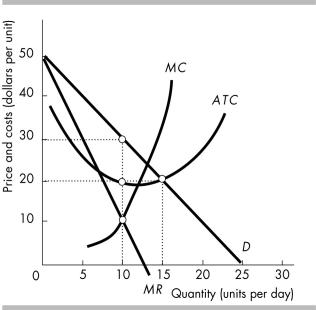
-The figure above shows the demand and cost curves for a single-price monopoly. The firm's economic profit equals
A) $0.
B) $300.
C) $100.
D) $50.
Correct Answer:
Verified
Related Questions
-The figure above shows the demand and cost curves for a single-price monopoly. The firm's economic profit equals
A) $0.
B) $300.
C) $100.
D) $50.
Correct Answer:
Verified

