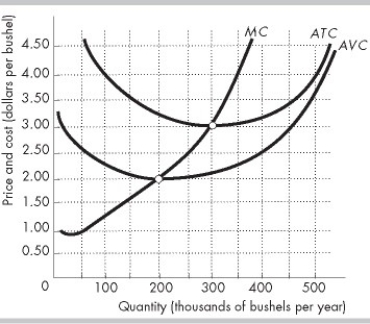
-The figure above shows a typical perfectly competitive corn farm, whose marginal cost curve is MC and average total cost curve is ATC. The market is initially in a long-run equilibrium, where the price is $3.00 per bushel. Then, the market demand for corn decreases and, in the short run, the price falls to $2.50 per bushel. In the new short-run equilibrium, the farm
A) incurs an economic loss of between $1 and $40,000.
B) makes zero economic profit.
C) incurs an economic loss of between $40,001 and $130,000.
D) incurs an economic loss of more than $130,001.
Correct Answer:
Verified
Q358: Q359: Q360: In the long run, a perfectly competitive Q361: The demand for a product produced in Q362: Suppose a perfectly competitive market is in Q364: The market for maple syrup is perfectly Q365: Initially, a perfectly competitive industry that has Q366: There is a technological advance in a Unlock this Answer For Free Now! View this answer and more for free by performing one of the following actions Scan the QR code to install the App and get 2 free unlocks Unlock quizzes for free by uploading documents![]()
![]()

