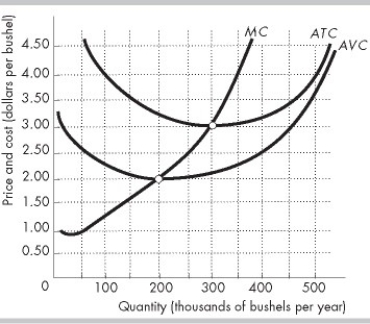
-The figure above shows a typical perfectly competitive corn farm, whose marginal cost curve is MC and average total cost curve is ATC. Assuming there are no changes in technology, in the long run the lowest possible price for corn is ________ per bushel.
A) $2.50
B) $2.00
C) $3.00
D) $3.50
Correct Answer:
Verified
Q362: Suppose a perfectly competitive market is in
Q363: Q364: The market for maple syrup is perfectly Q365: Initially, a perfectly competitive industry that has Q366: There is a technological advance in a Q368: In a perfectly competitive market that is![]()
Unlock this Answer For Free Now!
View this answer and more for free by performing one of the following actions

Scan the QR code to install the App and get 2 free unlocks

Unlock quizzes for free by uploading documents