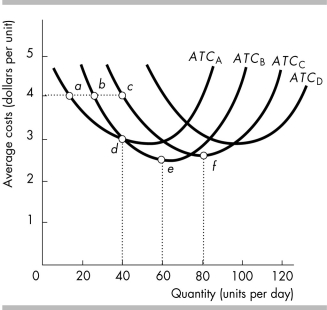
-The average total cost curves for plants A, B, C, and D are shown in the above figure. It is possible that the long-run average cost curve runs through points
A) a, b, and c. B) b, d, and e. C) d, e, and f. D) c and d.
Correct Answer:
Verified
Unlock this answer now Get Access to more Verified Answers free of charge