Solved

-The Average Total Cost Curves for Plant 1, ATC0, and Plant

Question 346

Multiple Choice

  -The average total cost curves for Plant 1, ATC<sub>0</sub>, and Plant 2, ATC<sub>1</sub>, are shown in the figure above. Over what range of output is it efficient to operate Plant 2? A)  0-20 B)  0-25 C)  20-25 D)  greater than 25
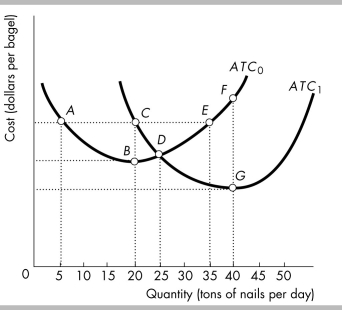
-The average total cost curves for Plant 1, ATC0, and Plant 2, ATC1, are shown in the figure above. Over what range of output is it efficient to operate Plant 2?


A) 0-20
B) 0-25
C) 20-25
D) greater than 25

Correct Answer:

verifed

Verified

Unlock this answer now
Get Access to more Verified Answers free of charge

Related Questions

Unlock this Answer For Free Now!

View this answer and more for free by performing one of the following actions

qr-code

Scan the QR code to install the App and get 2 free unlocks

upload documents

Unlock quizzes for free by uploading documents