Multiple Choice
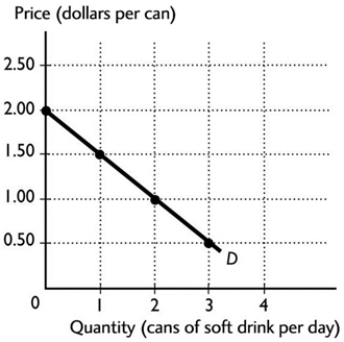 The graph illustrates the demand curve for soft drinks. After a rise in the price of a soft drink from $1.00 a can to $2.00 a can, the quantity of soft drinks demanded
A) decreases from 1 can to 0 cans a day.
B) remains unchanged.
C) increases from 0 cans to 2 cans a day.
D) decreases from 2 cans to 0 cans a day.
E) cannot be determined from the figure because the demand curve will shift to a new curve.
Correct Answer:
Verified
Related Questions
Q23: If macaroni and cheese is an inferior
Q29: If the demand for digital cameras increases
Unlock this Answer For Free Now!
View this answer and more for free by performing one of the following actions

Scan the QR code to install the App and get 2 free unlocks

Unlock quizzes for free by uploading documents