Multiple Choice
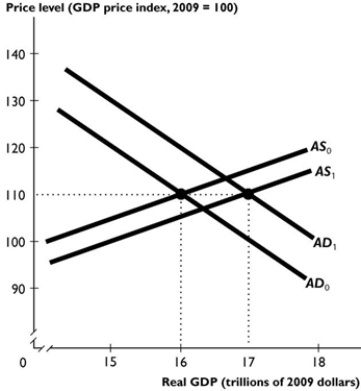 The figure above shows an economy's aggregate demand curve and aggregate supply curve.
-Suppose the shift from AD0 to AD1 and from AS0 to AS1 in the figure above is the result of fiscal policy. Which of the policies below could lead to these shifts?
i. An increase in government expenditure
ii. A tax cut
iii. A decrease in government expenditure
iv. A tax increase
A) iv only
B) iii and iv
C) i and iv
D) i and ii
E) i only
Correct Answer:
Verified
Related Questions

