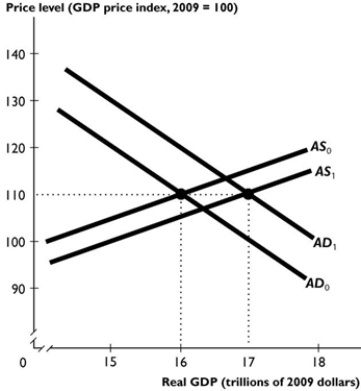
 The figure above shows an economy's aggregate demand curve and aggregate supply curve.
-Suppose the shift from AD0 to AD1 and from AS0 to AS1 is the result of fiscal policy. If the effect on aggregate supply was larger than the figure above shows, as a result the price level would be ________ 110 and real GDP would be ________ $17 trillion.
A) higher than; larger than
B) smaller than; less than
C) equal to; equal to
D) smaller than; larger than
E) equal to; larger than
Correct Answer:
Verified
Q58: There are four limitations to the effectiveness
Q59: The supply-side effects show that an income
Q60: If government expenditure increases by $200 billion
Unlock this Answer For Free Now!
View this answer and more for free by performing one of the following actions

Scan the QR code to install the App and get 2 free unlocks

Unlock quizzes for free by uploading documents