Multiple Choice
 The figure above shows some Phillips curves for an economy.
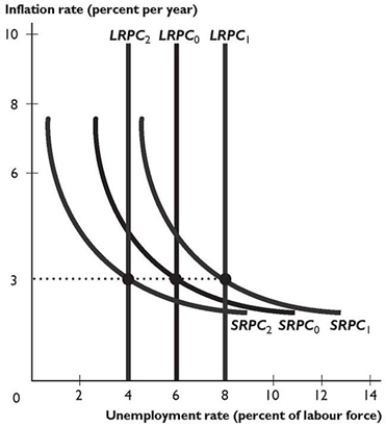
-In the figure above, the shift from the short-run Phillips curve SRPC0 and the long-run Phillips curve LRPC0 to the short-run Phillips curve SRPC1 and the long-run Phillips curve LRPC1 is the result of ________ in the expected inflation rate and ________ in the natural unemployment rate.
A) an increase; an increase
B) no change; an increase
C) a decrease; a decrease
D) an increase; no change
E) a decrease; no change
Correct Answer:
Verified
Related Questions
Q37: Data from the United States and the
Q38: The long-run Phillips curve applies when the
Q39: The lack of a long-run tradeoff between
Q40: The long-run Phillips curve shows the relationship

