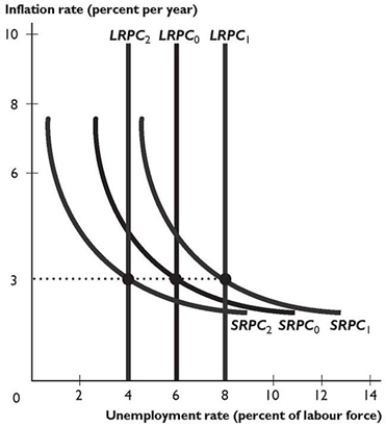
 The figure above shows some Phillips curves for an economy.
-In the figure above, the shift from the short-run Phillips curve SRPC0 and the long-run Phillips curve LRPC0 to the short-run Phillips curve SRPC2 and the long-run Phillips curve LRPC2 is the result of ________ in the expected inflation rate and ________ in the natural unemployment rate.
A) a decrease; a decrease
B) a decrease; an increase
C) no change; a decrease
D) an increase; no change
E) an increase; an increase
Correct Answer:
Verified
Q39: The lack of a long-run tradeoff between
Q40: The long-run Phillips curve shows the relationship
Q41: Q42: Q43: Q45: Due to a "baby bust" in the Q46: The short-run Phillips curve tradeoff becomes less Q47: Suppose an economy experiences a permanent increase Q48: According to the natural rate hypothesis, if Q49: Unlock this Answer For Free Now! View this answer and more for free by performing one of the following actions Scan the QR code to install the App and get 2 free unlocks Unlock quizzes for free by uploading documents![]()
![]()
![]()
![]()

