Figure 13.4
The amplitude as a function of driving frequency for three oscillators. 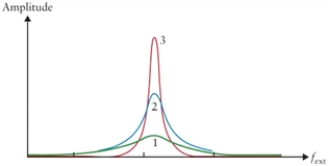
-Figure 13.4 shows the response of three oscillators to a driving frequency. The amplitudes are plotted as a function of frequency. If each of these three oscillators is started and then left as a free oscillator, discuss which will oscillate longest, which shortest, and why?
Correct Answer:
Verified
View Answer
Unlock this answer now
Get Access to more Verified Answers free of charge
Q39: Resonance occurs in a system with no
Q40: A simple harmonic system maintains constant frequency,
Q41: You want to measure the weight of
Q42: An object with a mass of 1.2
Q43: A 30 kg block is at rest
Q44: Figure 13.2 Q45: The total energy of a water molecule Q46: An object of mass 20 g is Q47: Figure 13.3 Q48: Calculate the period of oscillation of a![]()
![]()
Unlock this Answer For Free Now!
View this answer and more for free by performing one of the following actions

Scan the QR code to install the App and get 2 free unlocks

Unlock quizzes for free by uploading documents