Figure 53-5
Use the figure to answer the corresponding question(s) . 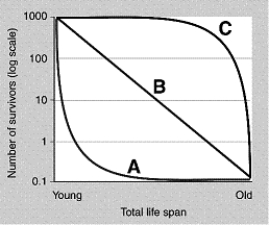
-Refer to Figure 53-5.The survivorship curve for elephants would be represented by the curve labeled:
A) A
B) B
C) C
D) Either A or C.It would depend upon the species.
E) Elephant populations would be better represented by a curve falling between A and B.
Correct Answer:
Verified
Q44: By the end of the 21st century,
Q45: These are good habitats where local reproductive
Q47: A population that is divided into several
Q48: Figure 53-6
Use the figure to answer the
Q49: These generally have greater population densities than
Q51: Figure 53-6
Use the figure to answer the
Q52: Which of the following pairs is incorrect?
A)
Q54: Figure 53-5
Use the figure to answer the
Q65: Write out the growth equation including the
Q79: The percentages of a population at different
Unlock this Answer For Free Now!
View this answer and more for free by performing one of the following actions

Scan the QR code to install the App and get 2 free unlocks

Unlock quizzes for free by uploading documents