Figure 53-6
Use the figure to answer the corresponding question(s) . 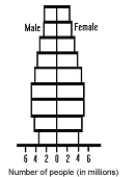
-Figure 53-6 represents the age structure diagram of:
A) the transition stage.
B) the preindustrial state.
C) a moderately developed country.
D) a developing country.
E) a highly developed country.
Correct Answer:
Verified
Q44: By the end of the 21st century,
Q44: A human population that is shrinking would
Q45: These are good habitats where local reproductive
Q47: A population that is divided into several
Q49: These generally have greater population densities than
Q50: The world human population has increased dramatically
Q50: Figure 53-5
Use the figure to answer the
Q51: Figure 53-6
Use the figure to answer the
Q52: Which of the following pairs is incorrect?
A)
Q65: Write out the growth equation including the
Unlock this Answer For Free Now!
View this answer and more for free by performing one of the following actions

Scan the QR code to install the App and get 2 free unlocks

Unlock quizzes for free by uploading documents