Figure 33-4
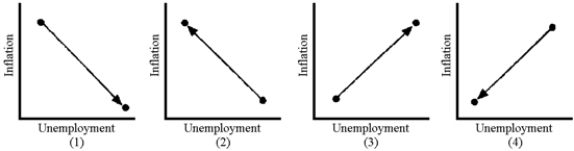
-Which panel in Figure 33-4 shows what happened in 2007-2009?
A) 1
B) 2
C) 3
D) 4
Correct Answer:
Verified
Q91: If the aggregate supply curve is vertical,
Q92: At the natural rate of unemployment, the
Q93: One piece of evidence that business fluctuations
Q94: If the fluctuations in the economy's real
Q95: Which of the following factors contributed to
Q97: If unemployment and inflation move inversely, then
Q98: In the 1960s and early 1970s, many
Q99: If aggregate demand in the United States
Q100: In the short run, fiscal and monetary
Q101: Figure 33-5
![]()
Unlock this Answer For Free Now!
View this answer and more for free by performing one of the following actions

Scan the QR code to install the App and get 2 free unlocks

Unlock quizzes for free by uploading documents