Figure 33-5
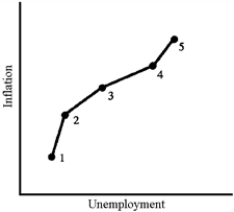
-Over a five-year period, economists observed that the unemployment-inflation relationship appeared as in Figure 33-5.Economic theory would conclude that the period
A) was dominated by supply shocks such as increased energy and food costs.
B) was affected by both supply and demand shocks, with demand shocks dominating.
C) was dominated by demand-side changes.
D) cannot be explained because the relationship is the opposite of what the Phillips curve would predict.
Correct Answer:
Verified
Q96: Figure 33-4 Q97: If unemployment and inflation move inversely, then Q98: In the 1960s and early 1970s, many Q99: If aggregate demand in the United States Q100: In the short run, fiscal and monetary Q102: If the favorable supply shocks of the Q103: In the 1990s, the rising value of Q104: If the aggregate supply curve shifts outward, Q105: One reason why the Phillips curve "broke Q106: Adverse shocks such as the crop failures
![]()
Unlock this Answer For Free Now!
View this answer and more for free by performing one of the following actions

Scan the QR code to install the App and get 2 free unlocks

Unlock quizzes for free by uploading documents