Figure 10-7
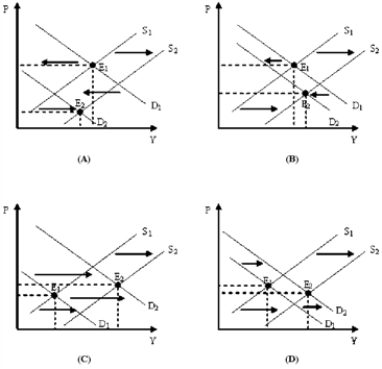
-Which of the diagrams in Figure 10-7 represents a decrease in consumer spending combined with a positive supply shock?
A) (A) and (B)
B) (C) and (D)
C) (A) and (C)
D) (B) and (D)
Correct Answer:
Verified
Q200: Figure 10-6 Q201: What causes the aggregate supply curve to Q202: As the multiplier process is working on Q203: Figure 10-9 Q204: The fact that severe fluctuations in inflation Q206: The case for government stabilization policy is Q207: Figure 10-7 Q208: Suppose we observe an economy experience an Q209: Figure 10-7 Q210: Figure 10-8 Unlock this Answer For Free Now! View this answer and more for free by performing one of the following actions Scan the QR code to install the App and get 2 free unlocks Unlock quizzes for free by uploading documents
![]()
![]()
![]()
![]()
![]()

