Multiple Choice
Figure 10-9
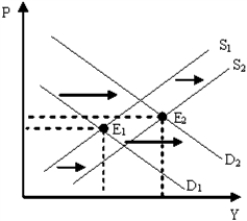
-Figure 10-9 describes which of the following periods in the United States?
A) 1930s
B) 1973-1975
C) late 1990s
D) 2007-2009
Correct Answer:
Verified
Related Questions
Q198: Figure 10-6 Q199: Figure 10-5 Q200: Figure 10-6 Q201: What causes the aggregate supply curve to Q202: As the multiplier process is working on Q204: The fact that severe fluctuations in inflation Q205: Figure 10-7 Q206: The case for government stabilization policy is Q207: Figure 10-7 Q208: Suppose we observe an economy experience an Unlock this Answer For Free Now! View this answer and more for free by performing one of the following actions Scan the QR code to install the App and get 2 free unlocks Unlock quizzes for free by uploading documents
![]()
![]()
![]()
![]()
![]()

