TABLE 14-9
The manufacturer of canned food constructed control charts and analyzed several quality characteristics. One characteristic of interest is the weight of the filled cans. The lower specification limit for weight is 2.95 pounds. The table below provides the range and mean of the weights of five cans tested every fifteen minutes during a day's production.
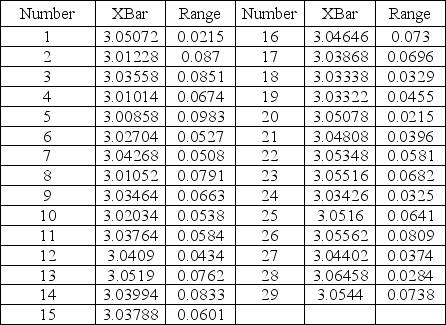
-Referring to Table 14-9, an R chart is to be constructed for the weight. One way to create the lower control limit involves multiplying the mean of the sample ranges by D₃. For this data set, the value of D₃ is ________.
Correct Answer:
Verified
Q81: TABLE 14-8
Recently, a university switched to a
Q82: TABLE 14-8
Recently, a university switched to a
Q82: Determining the root causes of why defects
Q83: TABLE 14-9
The manufacturer of canned food constructed
Q84: TABLE 14-9
The manufacturer of canned food constructed
Q85: TABLE 14-9
The manufacturer of canned food constructed
Q87: TABLE 14-9
The manufacturer of canned food constructed
Q88: TABLE 14-8
Recently, a university switched to a
Q90: TABLE 14-9
The manufacturer of canned food constructed
Q91: TABLE 14-9
The manufacturer of canned food constructed
Unlock this Answer For Free Now!
View this answer and more for free by performing one of the following actions

Scan the QR code to install the App and get 2 free unlocks

Unlock quizzes for free by uploading documents