Multiple Choice
Graph 8-1 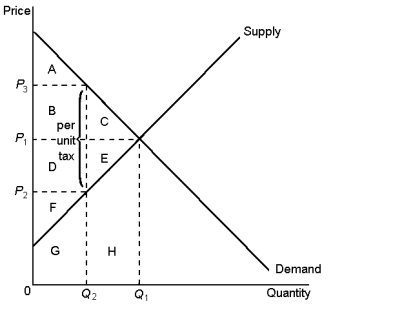
-According to Graph 8-1, the tax caused a reduction in consumer surplus, it is represented by area:
A) A
B) B + C
C) D + E
D) F
Correct Answer:
Verified
Related Questions
Q37: If an economy is on the downward
Q38: When a tax is levied on a
Q40: A tax on land will distort economic
Q41: Graph 8-2 Q43: Graph 8-1 Q44: Graph 8-2 Q45: The deadweight loss of a tax rises Q45: To evaluate the welfare effects of taxes Q46: Graph 8-1 Q47: Graph 8-1 Unlock this Answer For Free Now! View this answer and more for free by performing one of the following actions Scan the QR code to install the App and get 2 free unlocks Unlock quizzes for free by uploading documents![]()
![]()
![]()
![]()
![]()

