Multiple Choice
Graph 8-2 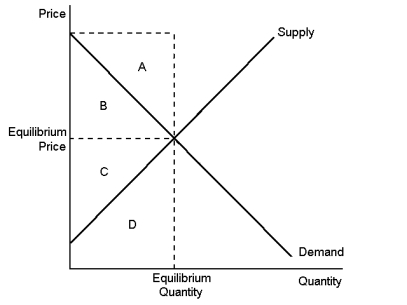 This graph shows supply and demand in a free market.
-According to Graph 8-2, total economic surplus would be represented by area:
A) A + B
B) B + C
C) C + D
D) A + D
Correct Answer:
Verified
Related Questions
Q37: If an economy is on the downward
Q38: When a tax is levied on a
Q40: A tax on land will distort economic
Q42: Graph 8-1 Q43: Graph 8-1 Q44: Graph 8-2 Q45: The deadweight loss of a tax rises Q45: To evaluate the welfare effects of taxes Q46: Graph 8-1 Q204: If the size of a tax doubles,the Unlock this Answer For Free Now! View this answer and more for free by performing one of the following actions Scan the QR code to install the App and get 2 free unlocks Unlock quizzes for free by uploading documents![]()
![]()
![]()
![]()

