The use of small aircraft with human observers is common in wildlife studies where
the goal is to estimate the abundance of different species. A more economical
strategy might be to use drones. The idea is that a drone would fly over the area of
interest and take photographs for computer analysis. The plot below is from a test run
of drones over 10 areas in South Central Florida. Bird decoys were used to test the
accuracy of the analysis of the photographs. A scatterplot of the actual number of
decoys and the number acquired from applying photographic analysis is shown
below. 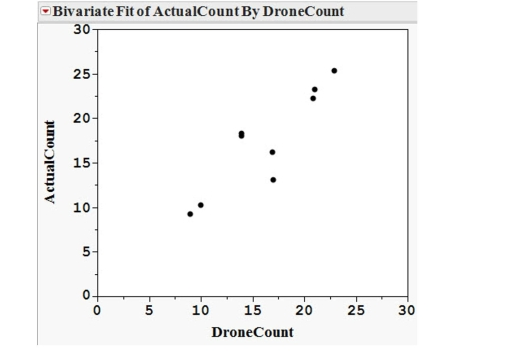
(a) The least squares line is (Drone). Graph this line on the scatterplot above.
(b) The least squares line is the line that minimizes the sum of the squared residuals. Using your line in part (a), graphically represent the residual associated with the drone count of 15 on the scatterplot.
Correct Answer:
Verified
View Answer
Unlock this answer now
Get Access to more Verified Answers free of charge
Q1: A large value of
Q2: Generally, a relatively small value of
Q3: The Des Moines Register reported the
Q3: The coefficient of determination is equal to
Q4: If on average y increases as x
Q8: Early humans were similar in shape
Q15: The slope of the least squares line
Q17: One of the properties of correlation coefficient,
Q18: What is it that the correlation coefficient
Q18: What is it that the correlation coefficient
Unlock this Answer For Free Now!
View this answer and more for free by performing one of the following actions

Scan the QR code to install the App and get 2 free unlocks

Unlock quizzes for free by uploading documents