The Des Moines Register reported the ratings of high school sportsmanship as compiled
by the Iowa High School Athletic Association. The participants and coaches from each
school were rated by referees. (1 = superior, 5 = unsatisfactory.) A regression analysis
of data on the average scores given to football players and coaches is shown below. 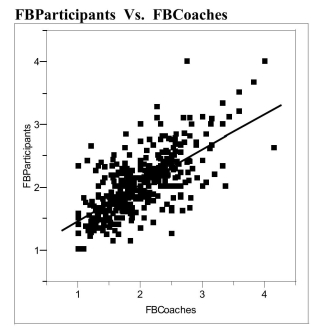
Linear Fit
FBParticipants FBCoaches
Summary of Fit
a) Interpret the value of the correlation between the ratings of coaches and
participants.
b) Interpret the value of the coefficient of determination.
c) Interpret the value of the standard deviation about the least squares line.
Correct Answer:
Verified
Q1: A large value of
Q2: Generally, a relatively small value of
Q3: The coefficient of determination is equal to
Q4: The use of small aircraft with
Q4: If on average y increases as x
Q8: Early humans were similar in shape
Q15: The slope of the least squares line
Q17: One of the properties of correlation coefficient,
Q18: What is it that the correlation coefficient
Q18: What is it that the correlation coefficient
Unlock this Answer For Free Now!
View this answer and more for free by performing one of the following actions

Scan the QR code to install the App and get 2 free unlocks

Unlock quizzes for free by uploading documents