The diagrams represent various states of abnormal hydration. In each diagram, the normal state (solid lines) is superimposed on the abnormal state (dashed lines) to illustrate the shifts in the volumes (width of rectangles) and total osmolarities (height of rectangles) of the extracellular fluid and intracellular fluid compartments.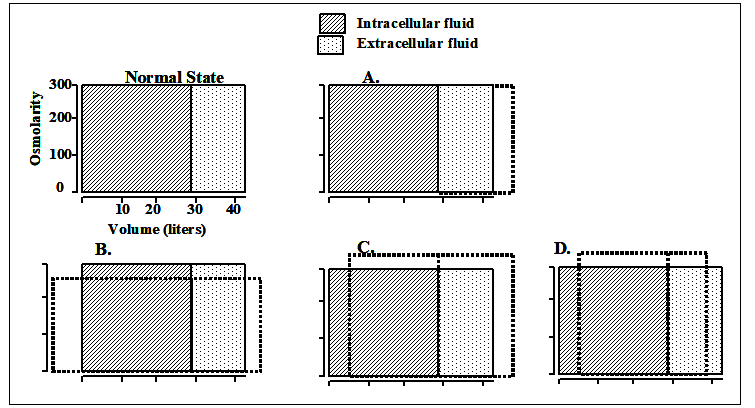
-Which of the diagrams represents the changes (after osmotic equilibrium) in extracellular and intracellular fluid volumes and osmolarities after infusion of a 2% solution of glucose (molecular weight of glucose = 180 g/mol) ?
A) A
B) B
C) C
D) D
Correct Answer:
Verified
Q11: A 55-year-old woman reports recent rapid weight
Q12: Which of the following changes would tend
Q13: Which of the following changes would you
Q14: If the tubular fluid/plasma creatinine concentration ratio
Q15: Which of the following changes would you
Q17: Compared with normal conditions, which one of
Q18: The diagrams represent various states of abnormal
Q19: Following Questions : Choose the appropriate nephron
Q20: Which part of the nephron normally reabsorbs
Q21: Assuming steady-state conditions and that water and
Unlock this Answer For Free Now!
View this answer and more for free by performing one of the following actions

Scan the QR code to install the App and get 2 free unlocks

Unlock quizzes for free by uploading documents