Multiple Choice
Figure 1 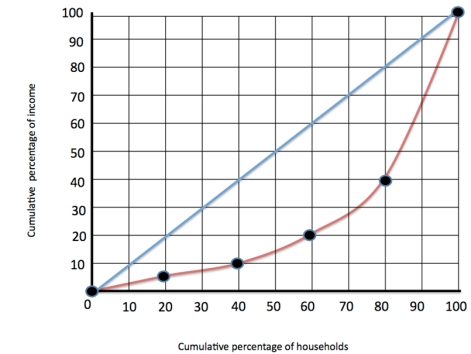
-Refer to Figure 1. The red line refers to
A) the Gini coefficient.
B) the Lorenz curve.
C) the line of perfect inequality.
D) the line of perfect equality.
Correct Answer:
Verified
Related Questions
Q2: Figure 1 Q3: Figure 2 Q4: The political philosophies of utilitarianism and liberalism Q5: A Gini coefficient of 0.7 suggests a Q5: There is an easy and perfectly acceptable Unlock this Answer For Free Now! View this answer and more for free by performing one of the following actions Scan the QR code to install the App and get 2 free unlocks Unlock quizzes for free by uploading documents![]()
![]()

