Using the graph below, answer the following questions:
a. What was the equilibrium price in this market before the tax?
b. What is the amount of the tax?
c. How much of the tax will the buyers pay?
d. How much of the tax will the sellers pay?
e. R7
f. R3
g. As a result of the tax, the level of market activity has fallen, from 60 units bought and sold to only 50 units bought and sold.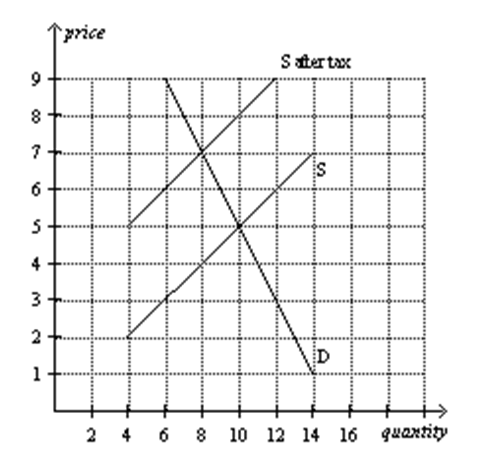
Correct Answer:
Verified
b. R3
c. R2
d. R1
e. R7
...
View Answer
Unlock this answer now
Get Access to more Verified Answers free of charge
Q41: The government is thinking about increasing the
Q41: What is the difference between a price
Q43: The government is thinking about increasing the
Q44: Using the graph shown ( below), analyze
Q45: Subsidies are levied when a government wants
Q47: Using the graph shown (below), analyze the
Q49: A subsidy is the opposite of a
Q50: Using the graph below, answer the following
Q51: Which of the following statements about the
Q192: Which of the following is correct? A
Unlock this Answer For Free Now!
View this answer and more for free by performing one of the following actions

Scan the QR code to install the App and get 2 free unlocks

Unlock quizzes for free by uploading documents