The figure given below represents the short run and long run Phillips curve.
Figure 14.4
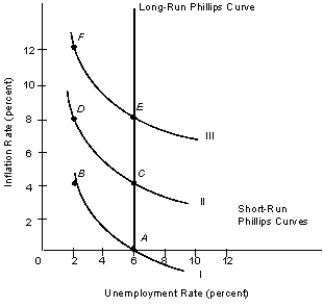
-Refer to Figure 14.4. Suppose the economy is located at point A, but the government increases spending because it believes that 6 percent unemployment is unacceptably high. If the adaptive expectations hypothesis holds, in the short run, the economy will move to:
A) point B.
B) point C.
C) point D.
D) point E.
E) point F.
Correct Answer:
Verified
Q41: Assume that a low-wage contract is in
Q42: Suppose that the economy has witnessed an
Q43: Which of the following techniques adopted by
Q47: If the public expects the incumbent administration
Q48: The figure given below represents the short
Q49: The figure given below represents the short
Q50: The business cycle that results from the
Q55: A time-inconsistent monetary policy is one that:
A)is
Q57: Which of the following will be a
Q58: Which of the following would not be
Unlock this Answer For Free Now!
View this answer and more for free by performing one of the following actions

Scan the QR code to install the App and get 2 free unlocks

Unlock quizzes for free by uploading documents