The figure given below represents the short run and long run Phillips curve.
Figure 14.4
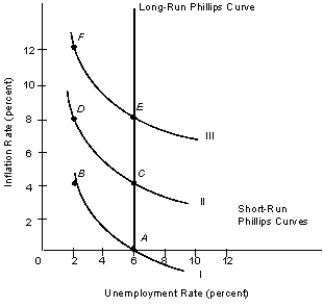
-Refer to Figure 14.4. Suppose the rational expectations hypothesis holds, and the Fed implements a fully expected increase in money supply growth. Starting from point C in the short run, the economy will tend to move to:
A) point A.
B) point B.
C) point D.
D) point E.
E) point F.
Correct Answer:
Verified
Q27: According to the rational expectations view:
A)the economy
Q43: Which of the following techniques adopted by
Q44: The figure given below represents the short
Q46: Which of the following gives the Fed
Q49: The figure given below represents the short
Q51: Suppose workers do not believe the Fed
Q53: The figure given below represents the short
Q55: A time-inconsistent monetary policy is one that:
A)is
Q56: Suppose that the Fed announces a low-money-growth
Q57: Which of the following will be a
Unlock this Answer For Free Now!
View this answer and more for free by performing one of the following actions

Scan the QR code to install the App and get 2 free unlocks

Unlock quizzes for free by uploading documents