he figure given below represents the business cycle of an economy.
Figure 7.1
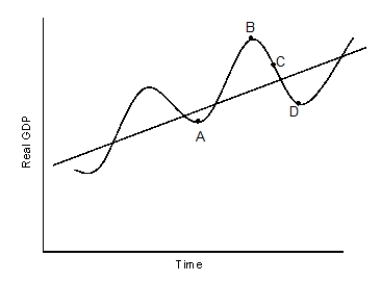
-Refer to Figure 7.1. At point D, lagging economic indicators should show that:
A) real GDP is expanding.
B) real GDP falls to zero.
C) real GDP is contracting.
D) real GDP growth is zero.
E) real GDP growth will be positive over time.
Correct Answer:
Verified
Q2: he figure given below represents the business
Q2: The long-run growth in the economy depends
Q4: In the business cycle, a trough marks
Q6: A leading indicator:
A)changes in either direction before
Q7: The part of a business cycle that
Q8: Which of the following individuals will not
Q11: Which of the following is observed in
Q12: Which of the following monthly data series
Q15: An increase in stock prices can be
Q20: The official dating of recessions in the
Unlock this Answer For Free Now!
View this answer and more for free by performing one of the following actions

Scan the QR code to install the App and get 2 free unlocks

Unlock quizzes for free by uploading documents