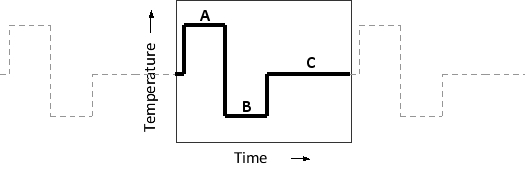
The following schematic graph shows temperature change over time in a cycle of a PCR assay. Which steps (A to C) in the cycle correspond to hybridization (annealing), strand separation (denaturation), and DNA synthesis (extension), respectively? Your answer would be a three-letter string composed of letters A to C, e.g. ACB.
Correct Answer:
Verified
View Answer
Unlock this answer now
Get Access to more Verified Answers free of charge
Q18: Which mass spectrometry instrument is most suitable
Q19: Due to friction with molecules of the
Q20: To create cellular factories for monoclonal antibody
Q21: You have devised genetic screens to identify
Q22: In a forensic lab, DNA samples from
Q24: In an unfolded (random coil) protein, amino
Q25: Indicate whether each of the following manipulations
Q26: Your friend has cut a 3000-nucleotide-pair circular
Q27: You have carried out a genetic screen
Q28: You have used a variation of fluorescence
Unlock this Answer For Free Now!
View this answer and more for free by performing one of the following actions

Scan the QR code to install the App and get 2 free unlocks

Unlock quizzes for free by uploading documents