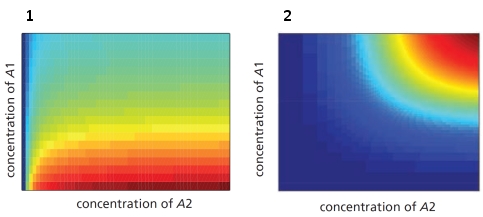
In the schematic graphs below, the red color indicates high gene expression and blue color indicates low gene expression. The expression level is plotted as a function of the concentrations of two transcription regulatory proteins, A1 and A2. Which graph (1 or 2) do you think corresponds to an "AND NOT" combinatorial logic? Write down 1 or 2 as your answer.
Correct Answer:
Verified
View Answer
Unlock this answer now
Get Access to more Verified Answers free of charge
Q85: You have set up a system of
Q86: The following graph shows the change in
Q87: Indicate whether each of the following better
Q88: Indicate which of the following network motifs
Q89: Bistability in a biological system can be
Q90: Consider a genetic network consisting of gene
Q92: The quantitative output of a gene depends
Q93: Imagine a bistable system composed of two
Q94: Consider two proteins A and B with
Q95: Consider a promoter sequence with n binding
Unlock this Answer For Free Now!
View this answer and more for free by performing one of the following actions

Scan the QR code to install the App and get 2 free unlocks

Unlock quizzes for free by uploading documents