Bistability in a biological system can be accompanied by hysteresis. Consider switchlike cellular responses to a signal molecule, as shown in the following graphs. In each graph, the solid curve corresponds to the change in cellular response when the signal concentration is being increased over time, whereas the dashed curve corresponds to the change when the signal concentration is being decreased. Which graph do you think corresponds to a system with a greater degree of hysteresis? What mechanism is responsible for this behavior? 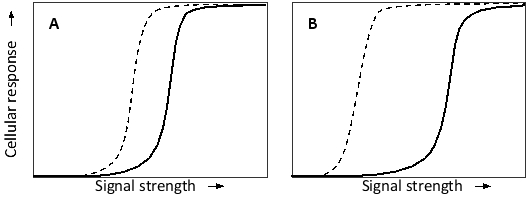
A) Graph A; negative feedback
B) Graph A; positive feedback
C) Graph B; negative feedback
D) Graph B; positive feedback
Correct Answer:
Verified
Q84: Consider the transcriptional circuits depicted in the
Q85: You have set up a system of
Q86: The following graph shows the change in
Q87: Indicate whether each of the following better
Q88: Indicate which of the following network motifs
Q90: Consider a genetic network consisting of gene
Q91: In the schematic graphs below, the red
Q92: The quantitative output of a gene depends
Q93: Imagine a bistable system composed of two
Q94: Consider two proteins A and B with
Unlock this Answer For Free Now!
View this answer and more for free by performing one of the following actions

Scan the QR code to install the App and get 2 free unlocks

Unlock quizzes for free by uploading documents