In the following graph, the magnitude of concentration difference across the nuclear pore complexes (NPCs) is plotted for four molecules (A to D) as a function of time, starting from an arbitrarily chosen initial concentration difference. Indicate which curve corresponds to each of the following molecules. Your answer would be a four-letter string composed of letters A to D only, e.g. ABCD.
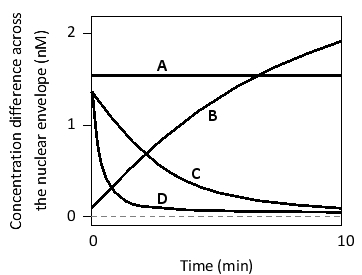
( ) A large protein that is being actively transported across the NPC
( ) A small water-soluble molecule
( ) A small protein composed of a few dozen residues
( ) A large protein that is NOT actively transported into or out of the nucleus
Correct Answer:
Verified
While small molecules and proteins of ...
View Answer
Unlock this answer now
Get Access to more Verified Answers free of charge
Q9: Cyclin B1, a key cell cycle regulatory
Q10: The formation of a stable ternary complex
Q11: According to the model for nuclear transport
Q12: Indicate whether the location of each of
Q13: Indicate true (T) and false (F) statements
Q15: Consider a human liver hepatocyte. Among the
Q16: Consider a human cell such as a
Q17: Consider a transcription regulatory protein that has
Q18: Indicate whether each of the following transport
Q19: Consider two cells, A and B. Both
Unlock this Answer For Free Now!
View this answer and more for free by performing one of the following actions

Scan the QR code to install the App and get 2 free unlocks

Unlock quizzes for free by uploading documents