In the following graphs, the cellular response, as measured in real time by the concentration of a certain active effector protein, is plotted over time for five cell types (A to E) that are treated with three different concentrations of a signal molecule. During the time period indicated by the horizontal gray bar, the signal molecule is present in the culture media at a concentration of 1 nM (dotted curve), 5 nM (gray curve), or 25 nM (solid curve). Answer the following question(s) based on these graphs.
-Which of the cell types A to E shows the lowest sensitivity to the signal?
A)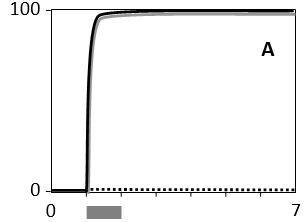
B)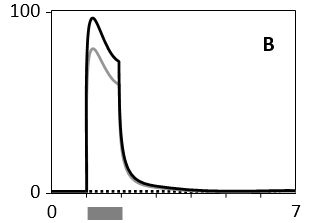
C)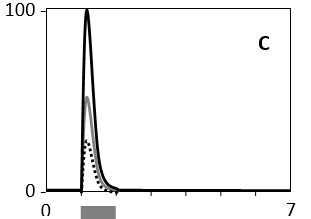
D)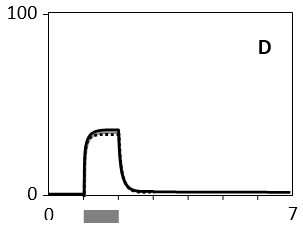
E)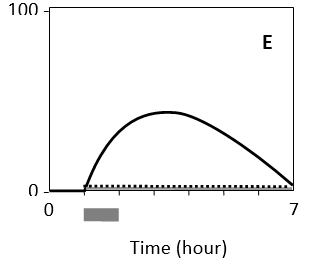
Correct Answer:
Verified
View Answer
Unlock this answer now
Get Access to more Verified Answers free of charge
Q11: A cell expresses a transmembrane protein that
Q12: In the following simplified diagram, the activation
Q13: Cells can adapt to extracellular signal molecules
Q14: Which of the following events normally activates
Q15: In the following graphs, the cellular response,
Q17: Consider a signaling protein that can be
Q18: Which of the following molecular mechanisms is
Q19: You grow a tumor-derived cell line in
Q20: Some signaling pathways in the cell are
Q21: Which of the following is a major
Unlock this Answer For Free Now!
View this answer and more for free by performing one of the following actions

Scan the QR code to install the App and get 2 free unlocks

Unlock quizzes for free by uploading documents