According to the following graph, which shows the elongation rate at the plus and minus ends of actin filaments as a function of actin subunit concentration, at what concentration (A to E) does the total length of the filament remain more or less constant with time (i.e. steady-state treadmilling occurs)? 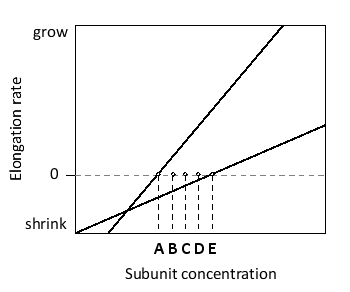
Correct Answer:
Verified
Q2: In the polymerization in vitro of actin
Q3: Consider the ATP-bound and ADP-bound forms of
Q4: The actin-nucleating protein formin has flexible "whiskers"
Q5: Fill in the blank: Each microtubule is
Q6: Which of the following cytoskeletal filaments are
Q7: If the concentration of free subunits is
Q8: Indicate true (T) and false (F) statements
Q9: In the following graph of actin elongation
Q10: Which of the following is an actin
Q11: F-actin is not a straight polymer but
Unlock this Answer For Free Now!
View this answer and more for free by performing one of the following actions

Scan the QR code to install the App and get 2 free unlocks

Unlock quizzes for free by uploading documents