In the following graph, the elongation rate of pure actin filaments as a function of actin subunit concentration is shown as a dashed line. Which one of the other five lines (A to E) would you think better shows what happens when a plus-end capping protein such as CapZ is present? 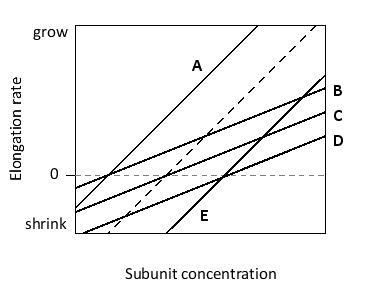
Correct Answer:
Verified
View Answer
Unlock this answer now
Get Access to more Verified Answers free of charge
Q30: Skeletal muscle cells consume enormous amounts of
Q31: Consider the structure of a sarcomere. Which
Q32: Sort the following events to show the
Q33: The proteins of the ERM family such
Q34: Indicate true (T) and false (F) statements
Q36: Actin filaments that are held together by
Q37: In the structure of which of the
Q38: Cofilin binds preferentially to ADP-containing actin filaments
Q39: The pathogen Listeria monocytogenes can hijack the
Q40: After an animal dies, its muscles start
Unlock this Answer For Free Now!
View this answer and more for free by performing one of the following actions

Scan the QR code to install the App and get 2 free unlocks

Unlock quizzes for free by uploading documents