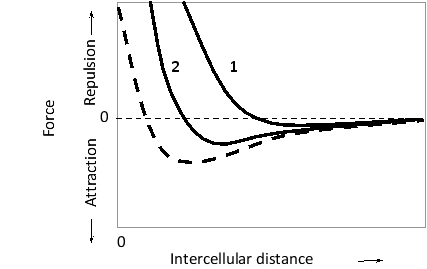
In the following schematic diagram, the estimated attractive or repulsive force between two adhesive cells is plotted as a function of distance between the cells. The dashed curve represents a condition under which the cells express cadherin but not N-CAM. The other two curves represent conditions under which both cadherin and heavily sialylated N-CAM are expressed. In one of the conditions, however, the ionic strength of the medium has been artificially increased by addition of salt. Which curve (1 or 2) do you think represents the high-salt condition? Write down 1 or 2 as your answer.
Correct Answer:
Verified
View Answer
Unlock this answer now
Get Access to more Verified Answers free of charge
Q2: Selectins …
A) mainly mediate cell-matrix attachments.
B) are
Q3: Cadherin molecules at the cell surface are
Q4: Consider a sheet of epithelial tissue that
Q5: Plasmodesmata in plant cells are functionally similar
Q6: Indicate true (T) and false (F) statements
Q8: Indicate whether each of the following descriptions
Q9: Consider two cells attached to each other
Q10: Overproduction of cadherins such as E-cadherin …
A)
Q11: Fill in the blank in the following
Q12: Cells expressing either N-cadherin (A), high levels
Unlock this Answer For Free Now!
View this answer and more for free by performing one of the following actions

Scan the QR code to install the App and get 2 free unlocks

Unlock quizzes for free by uploading documents