The line graph shows the recorded hourly temperatures in degrees Fahrenheit at an airport. 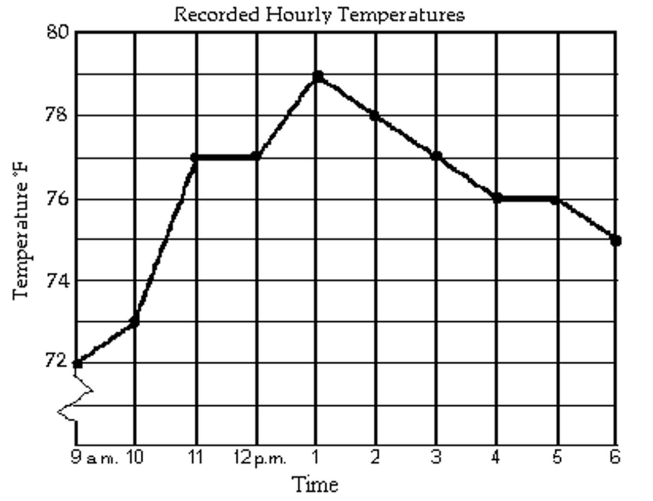
-During which hours shown was the temperature greater than 76°F?
A) 10 a.m. to 3 p.m.
B) 11 a.m. to 3 p.m.
C) 11 a.m. to 5 p.m.
D) 10 a.m. to 5 p.m.
Correct Answer:
Verified
Q108: The bar graph shows the number of
Q109: Fill in the blank with one
Q110: The bar graph shows the number of
Q111: Fill in the blank with one
Q112: Use the information given to draw
Q114: The pictograph shows the number of bicycles
Q115: Fill in the blank with one
Q116: The following circle graph displays Chris
Q117: The pictograph shows the number of bicycles
Q118: Fill in the blank with one
Unlock this Answer For Free Now!
View this answer and more for free by performing one of the following actions

Scan the QR code to install the App and get 2 free unlocks

Unlock quizzes for free by uploading documents