The following circle graph displays Chris and Mary Smith's monthly $2900 family budget. Use the circle graph to answer
the question. 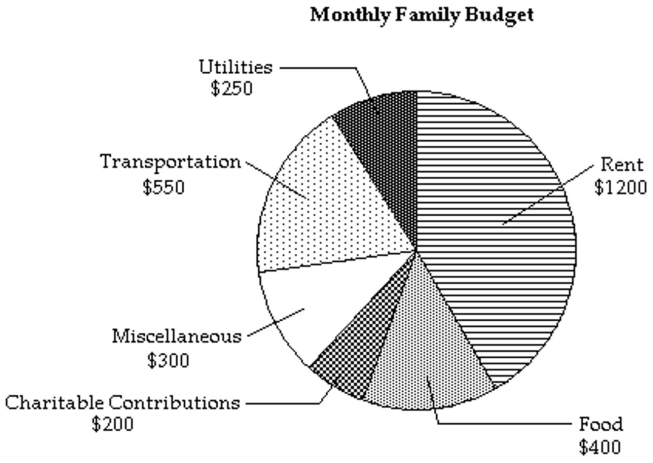
-What is the ratio of money spent on food to money spent on utilities?
A)
B)
C)
D)
Correct Answer:
Verified
Q111: Fill in the blank with one
Q112: Use the information given to draw
Q113: The line graph shows the recorded hourly
Q114: The pictograph shows the number of bicycles
Q115: Fill in the blank with one
Q117: The pictograph shows the number of bicycles
Q118: Fill in the blank with one
Q119: Fill in the blank with one
Q120: The bar graph shows the number of
Q121: The circle graph summarizes the results of
Unlock this Answer For Free Now!
View this answer and more for free by performing one of the following actions

Scan the QR code to install the App and get 2 free unlocks

Unlock quizzes for free by uploading documents